Food grain Supply-Chain planning & optimization across Indian states

Food Grain Supply Chain Optimization across Indian states

PURPOSE 

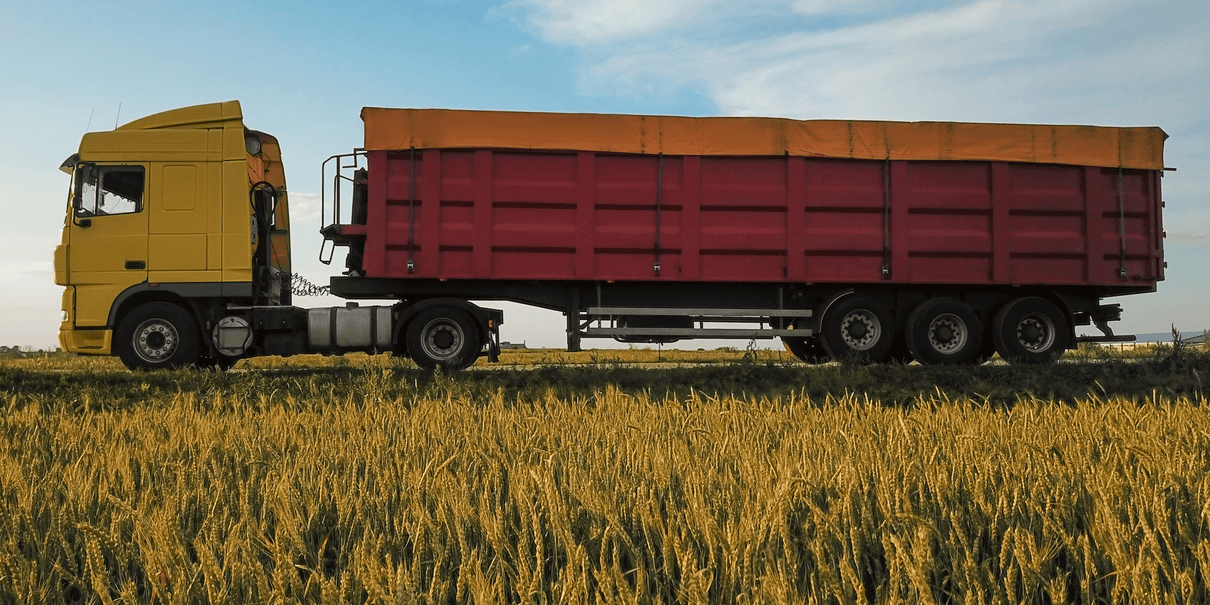
Foodgrain supply chains are one of the few determinants of food security of India’s poor and vulnerable sections Lapses in these supply chains, as the entire world is realizing due to current Geopolitical circumstances:

  • potentially undermines the national food security scenario
  • causes wastage due to storage and transit deficiencies 

The central government has adopted several plans and schemes such as ‘end to end computerisation of TPDS operations’ to upgrade monitoring and avoid fraudulent beneficiaries. However, none of this directly address supply chain efficiencies. Accordingly, our project addresses the following challenges: 

  • grain overflow issues arising due to greater procurement for lower storage capacity
  • regular transportation in hilly terrains affected by climatic conditions 

Overall, making the supply chain logistics more efficient & effective by reducing cost and enhancing access.

PROJECT

States incur high transportation costs for TPDS due to difficult terrain, limited resources, restricted windows for transportation and disintegrated storage spaces. To address this and ensure pre-prepositioning of adequate safety stocks in the areas where access is affected by seasonal and predictable hazards, the Public Systems Lab supports the states through supply chain optimization. An Operations Research (OR) based mathematical programming model helps minimize the total transportation cost while incorporating all practical conditions to make it implementable. 

Outcome:  

WAY AHEAD

The PSL currently is building supply chain optimization models in all states across the country based on their specific requirements. As already demonstrated, our strategically planned modeling interventions will:

  • respond to the challenges and contingencies of different states
  • drastically reduce the levels of food wastage, while effectively meeting the needs of all targeted beneficiaries
  • reduce the cost of transportation for the government, and
  • expand to include allied logistical challenges as required by the states

Our team will have experts from academia (IITs) and a strong partnership with the leading multilateral organization in this area, the United Nations (UN) World Food Programme (WFP). Leveraging expertise from various stakeholders, as required, the project team will increase efficiency and effectiveness in PDS. 
.

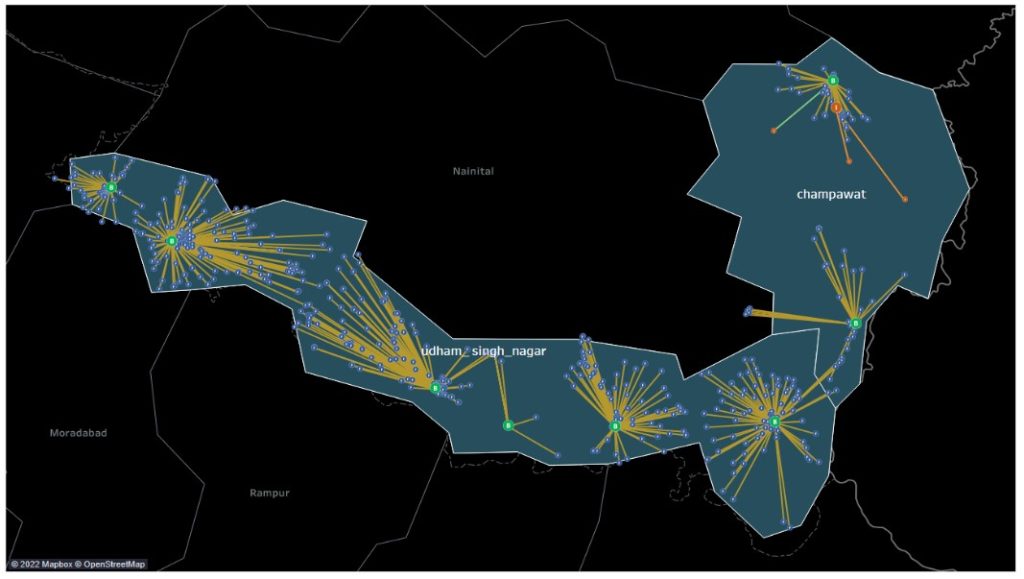
Fig: Optimal plots shown for the districts of Udham Singh Nagar and Champawat. Uttarakhand

A passage to clean air

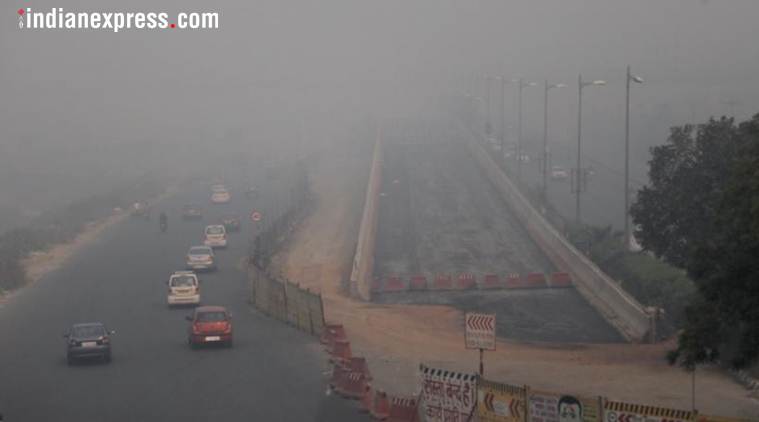
Air pollution kills 7 million people every year. India has 14 out of 20 most polluted cities in the world. Urgent need of comprehensive action plan throughout the year. Provide solutions for clean air in Delhi for better health and quality of life.

Climate Smart Agriculture Toolkit

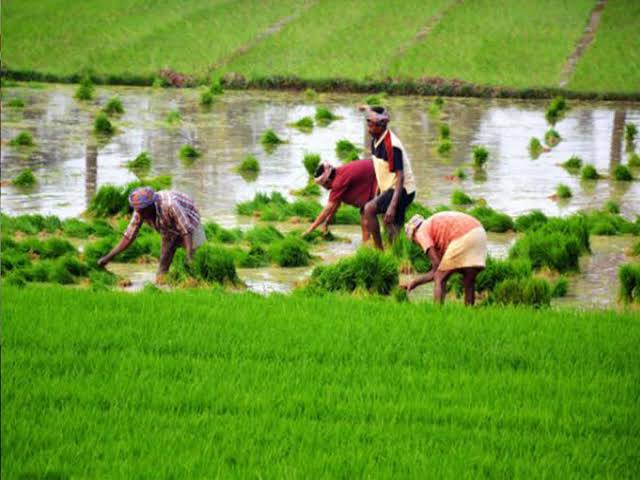
Novel tool with graphic user interface used in India and parts of South Asia by the International Water Management Institute (IWMI). Toolkits for climate smart agriculture prioritization and food stock planning. Provides optimal land allocation decisions for crops, location of warehouses and distribution plan.

Bus Operations Toolkit (BOT)

Introduction to the project:

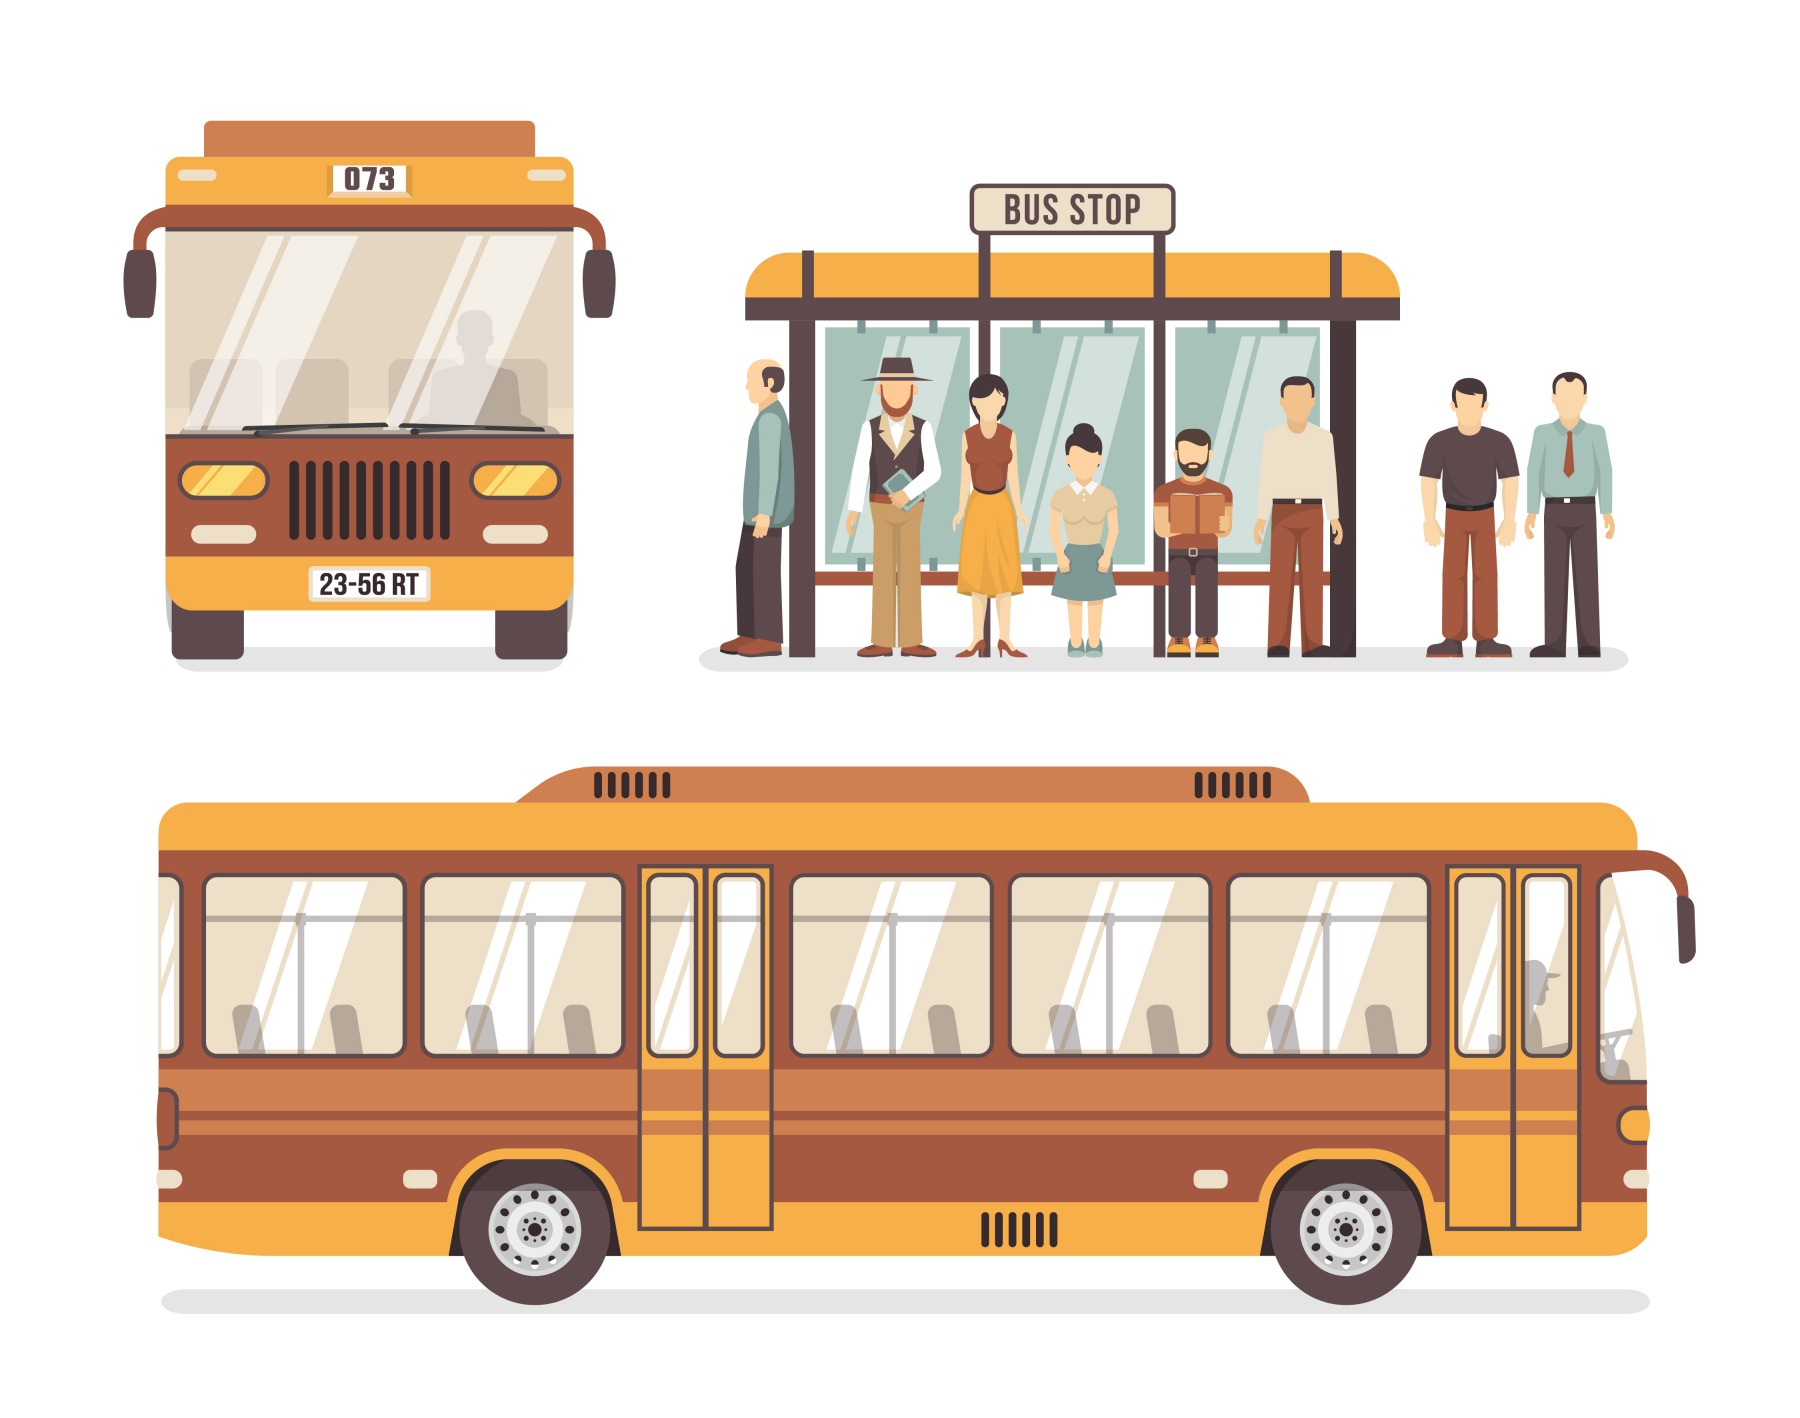
For every city public transportation plays an important role in its growth. It important to have the reliable public transport service and cater the service demand of the city. A city can have widespread route network, and PT agency with large bus fleet size operates through its different depots. Due to this depot-based scheduling of the buses, final timetable of the buses can have a different problem like overlapping of trips, inconsistent headway, and underutilization of the buses.

In our project, we have identified this issue in the current timetable of Bangalore Metropolitan transport corporation (BMTC), which is one of the India’s largest public transport service providers. BMTC has 6565 buses operating on 2203 different routes across the city. The daily number of trips done are 47353.

Our objective for the project is:

  • To remover the overlapping trips from the timetable i.e., overlaps are defined as multiple trips by different buses from same origin to destination following the same route.
  • To ensure the proper breaks after each trip
  • To increase the bus utilization and improve the service reliability.

Representation of overlapping trips

After analyzing the dataset provided by BMTC we found out that given schedule has total 4143 overlapping trips, and almost 50% of the buses are involved in the overlaps. We have represented the hourly band wise overlaps as below:


To address this issue a toolkit is developed with the following approach:

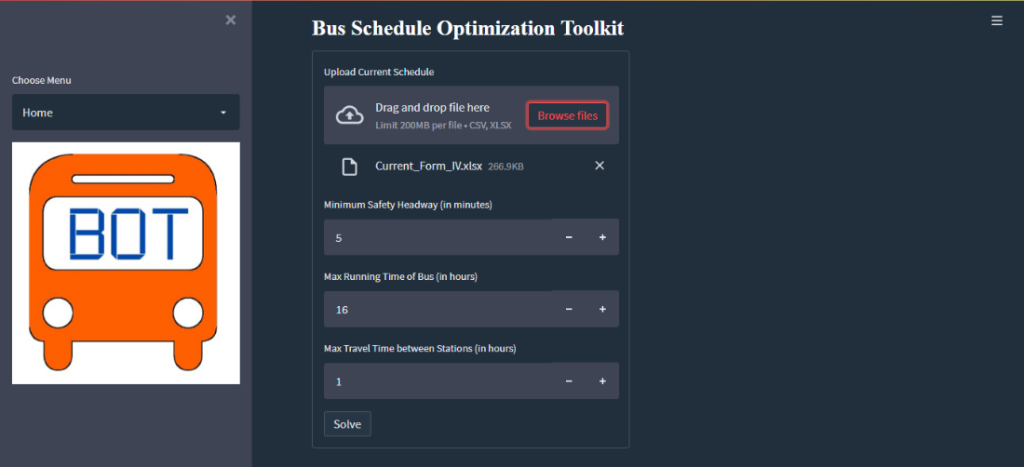
A desktop-based toolkit using the python code is developed, which follows the operation research techniques for the optimization and effective utilization of the bus fleet. GUI of the toolkit looks like follows:

As we can see in the above GUI, a toolkit needs only four inputs, 1. Current schedule of the buses in excel file format 2. Minimum safety headway allowed in minutes which is used for the rescheduling of overlapping trips 3. Maximum running hours of bus in day and 4. Maximum travel time to go from one bus stop to another across the city


Impacts and benefits:

Following are the direct impacts:

  1. Overlapping trips in case of BMTC were reduced to 0 from 4143
  2. 2309 redundant trips were removed from timetable
  3. Effective redeployment of 1249 buses were done
  4. Based on the effective redeployment 82 additional buses were available 
  5. Additional revenue of ~25.83 crores can be generated annually
  6. ~48,000 daily i.e., 1.75 crore additional passenger trips can be added in the timetable

Welfare benefits:


Smart Warehouse

                    IoT based SMART WAREHOUSE


PURPOSE

A substantial amount of post-harvest food grains wastage in India (about 10%) is due to:

  • widespread inadequacy in storage and infrastructure capabilities. With 
  • more produce than the available amount of storage space available across the nation. 

It therefore becomes a challenge to adequately, preserve and handle foodgrains with minimum spoilage. Keeping these concerns in mind, the IoT based smart warehouse is based on state of the art technology

PROJECT

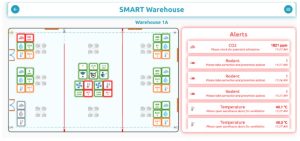
Internet of Things (IoT) based Smart Warehouse is highly effective mechanism of foodgrain storage management and will ensure rightful utilization through structured monitoring of various parameters in real time. The warehouse is equipped with state-of-the-art technology like temperature sensors, air quality sensor, passive infrared motion sensors for rodents, phosphine fumigation sensor, missing bag identification and many more. It aims to achieve a significant reduction of food wastage caused due to traditional storage practices while identifying the sources of waste to develop further solutions against foodgrain losses. The project also enables:

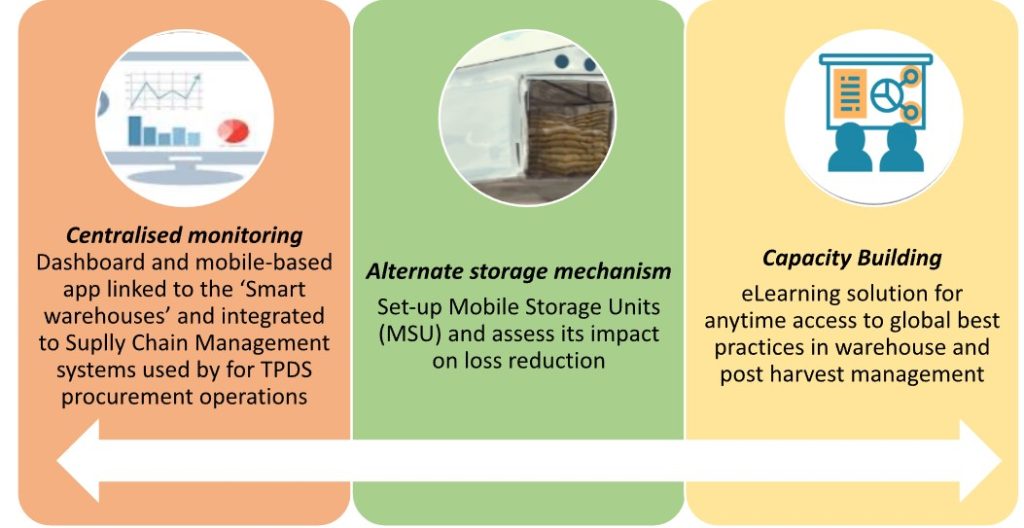
  • Dashboard & mobile-based app linked to warehouses & integrated to Supply Chain Management systems used for the TPDS & procurement operations
  • Set-up Mobile Storage Units (MSU) and assess impact on loss reduction 
  • eLearning solution for anytime access to global best practices in warehouse and post-harvest management                                                                              

OUTCOME 

  • Effective storage and distribution of foodgrains 
  • Significant food waste reduction
  • Real time monitoring of activities in warehouses

                                                                                                                                                            GUI- Monitoring

The IoT based Smart Warehouse apart from the above-mentioned outcomes will also impact a number of stakeholders ranging from the National/state/district officers to the farmers:

  • Data driven policy formulation & drill down view of warehouse operations for Government officials
  • Enable data driven planning, performance analysis and corrective recommendations
  • Access to updated information & input/output market channels for Farmers

The Public Systems Lab looks forward to repeat the installation of Smart Warehouses across all the states of India. Multiplying the deployment of smart warehouses will:

  • Show tremendous results in terms of checking and controlling foodgrain wastage 
  • Skills and manpower in demand will increase scope for employment

Sustainable Development Goals 2 (zero Hunger) Dashboard

SDG2-Rajasthan Dashboard

Objective: 

To visualize the state, district and sub-district indicators and data for SDG 2 monitoring to enable evidence-based policymaking to support the efforts of Government of Rajasthan in achieving food and nutrition security in the state. “This includes embed tables, maps and other visualisation tools (Bar charts, Pie charts, Radar charts, etc.) in dynamic form, for SDG-2 vulnerability assessment at the state, district and sub-district level, in the dashboard developed on a user-friendly platform. The main expected outcome of this is to have robust SDG-2 dashboard that enables evidence-based monitoring and identification of vulnerable hot-spots for strategic planning and targeted action for achieving ‘Zero Hunger’ in the state of Rajasthan

Development of SDG2-Dashboard

Front end of our SDG-2 dashboard is designed in ReactJS framework, and the backend is developed in PHP Language.

ReactJS is a declarative, fast, and adaptable JavaScript toolkit for creating user interface components. Facebook created ReactJS in its newsfeed area in 2011, but it was released to the public in May 2013. 

Why we used React JS for front end design?

  1. Helps in building high quality and rich user interfaces.
  2. Fast rendering and high performance can handle complex and high loading apps.
  3. Flexible and easy to maintain and allow writing custom components.
  4. Strong community, third party open-source components easily available. 

PHP (short for Hypertext Pre-processor) is the most widely used open source and general purpose server side scripting language used mainly in web development to create dynamic websites and applications. It was developed in 1994 by Rasmus Lerdorf.

Why we used PHP for backend design?

  1. Gives Web Developer more control.
  2. Database Connectivity.

Introduction of SDG-2 Dashboard

The main objective of the dashboard is to provide evidence-based monitoring and identification of vulnerable hot-spots for strategic planning and targeted action for achieving ‘Zero Hunger’. The dashboard will visualize the state and district indicators and data for SDG 2 monitoring to enable evidence-based policymaking to support the efforts of government in achieving food and nutrition security. The dashboard has 4 page i.e. Home Page, State performance, District performance and Rajasthan SDG2-Index. The functionality of dashboard is discusses below.

Functionality of SDG-2 Dashboard

Home Page

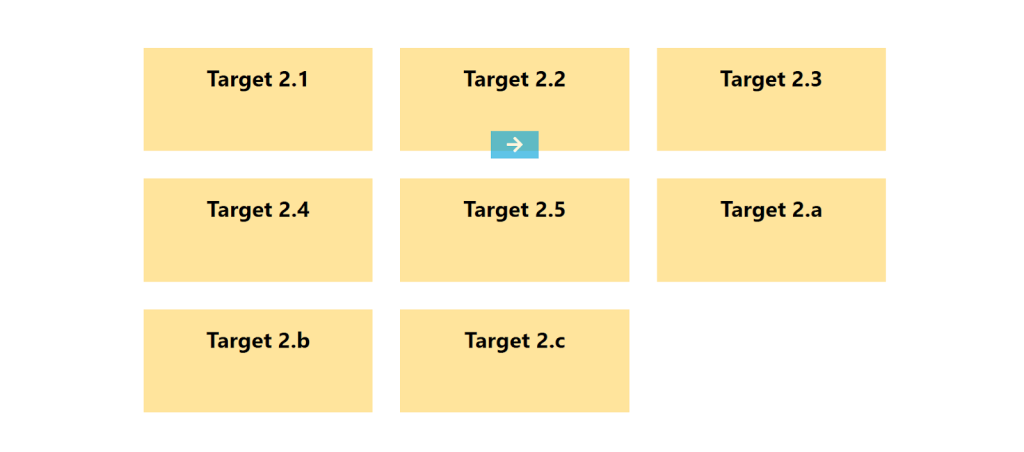
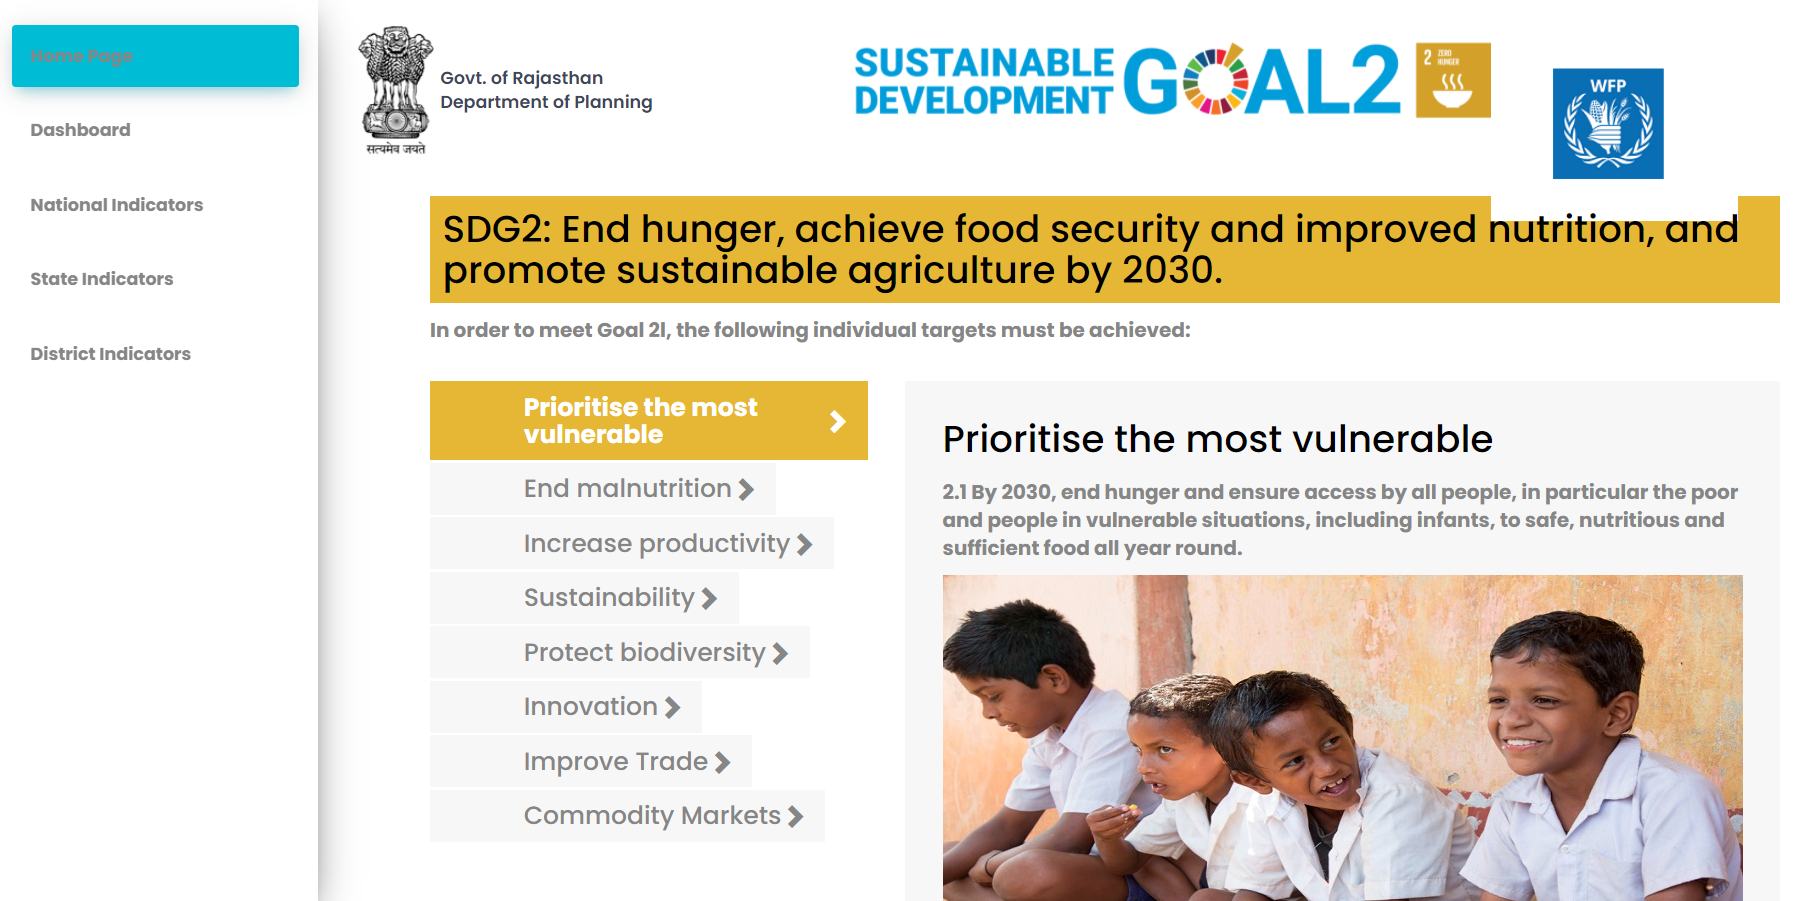
The home page is divided into 2 section. In the top section we have name of all the targets associated with SDG-2 along with the picture that depicts the goal and motive of the target. In the bottom section, we have cards depicting all the targets. User can click on the target and will be re-directed to the state performance which will show the performance of first indicator associated with the clicked target.

Top Section of Home Page

Bottom Section of Home Page

State Performance

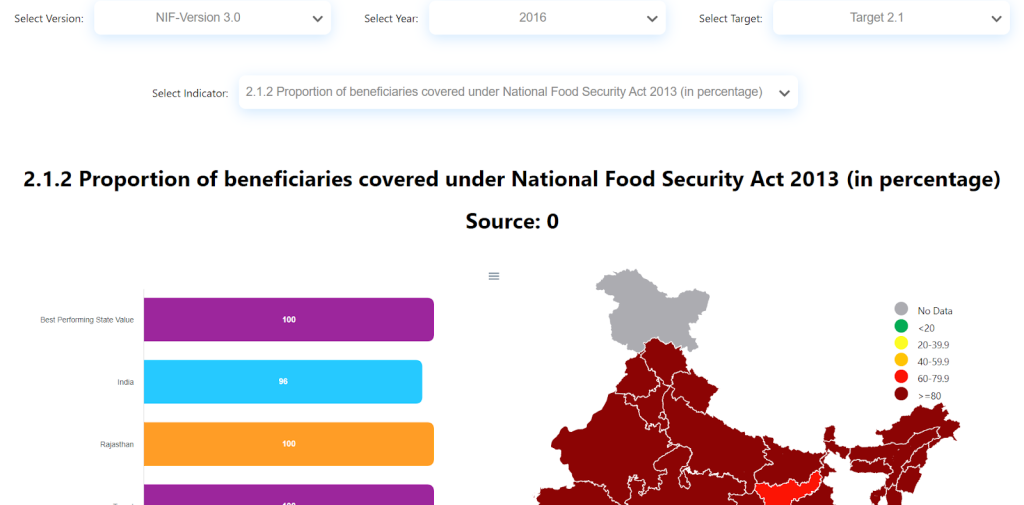
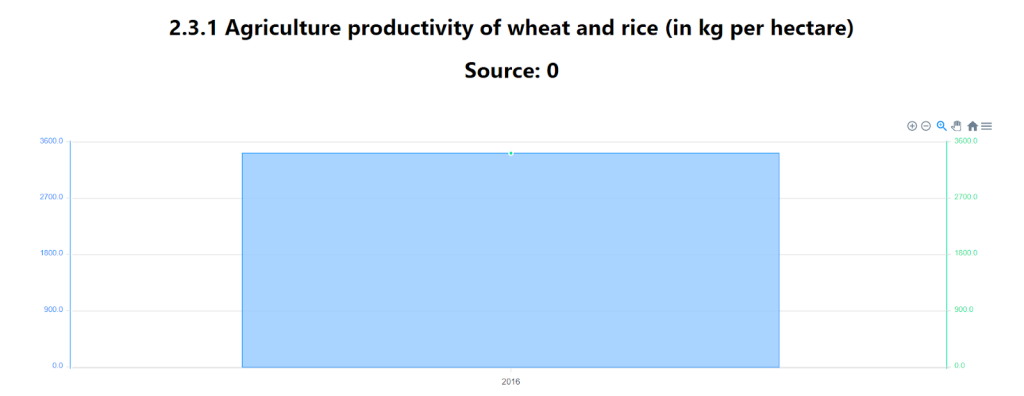
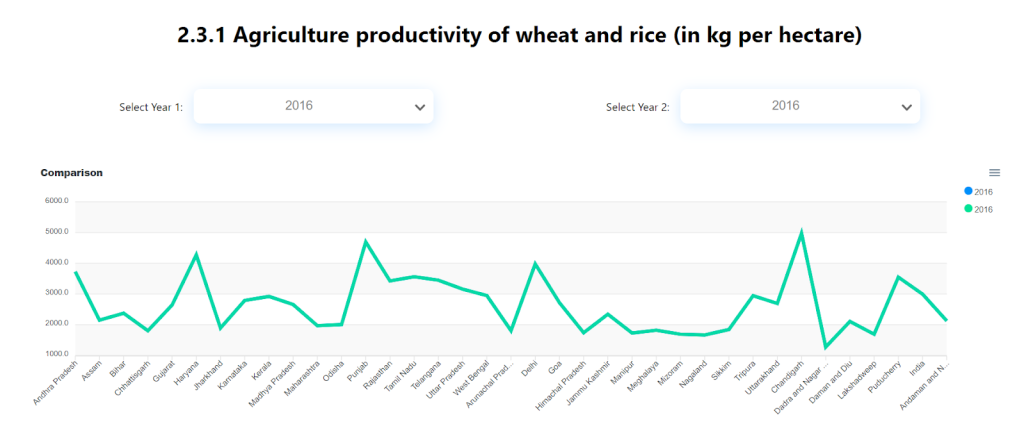
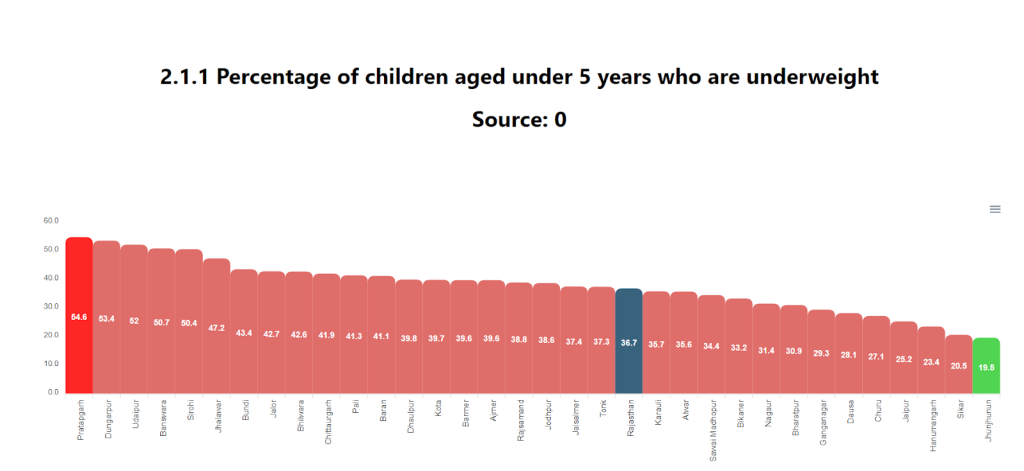
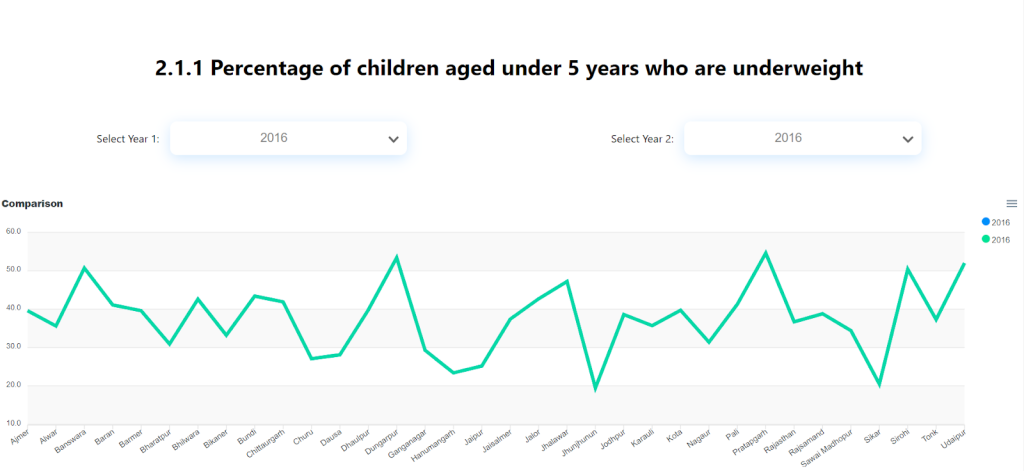
The state performance is divided into 3 section. Here user first need to select the version of the data ,then select the year in which the version is used, then select the target whose performance need to be monitor and then select the respective indicator with respect to the chosen target. In the first session user will see two info graphics. On left side, there is horizontal bar graph will depicts the best performing state, worst performing state, Rajasthan value and standard value of the indicator. On the right side, there is map of India which depicts the performance of all the states with respect to the indicator chosen by hovering on the states. In the middle portion, user can find the performance of all the years with respect to the chosen version. In the bottom portion, user can compare the performance of the 2 selected years with respect to chosen indicator.

Top Section of State Performance Page

Middle Section of State Performance Page

Bottom Section of State Performance Page

District Performance Page

The district performance is divided into 3 section. Here user first need to select the version, then select the year in which the version is used, then select the target whose performance need to be monitor and then select the respective indicator with respect to the chosen target. In the first session user will see two info graphics. On left side, there is horizontal bar graph will depicts the best performing district, worst performing state, and Rajasthan value of the indicator. On the right side, there is map of Rajasthan which depicts the performance of all the districts with respect to the indicator chosen by hovering on the districts. In the middle portion, user can find the performance of all the district with respect to the chosen indicator and compare it with Rajasthan performance. In the bottom portion, user can compare the performance of the 2 selected years with respect to chosen indicator.

Top Section of District Home Page

Middle Section of District Performance Page

Middle Section of District Performance Page


Bottom Section of District Performance Page

Rajasthan SDG2-Index

The SDG-2 Rajasthan Index page is divided into 3 section. Here user need to select the version. Once the version is selected the info graphics are represented. The first session there will be map of Rajasthan district on the left side which depicts the overall performance of the district. On the right side, there will be table with represent the indicative value of the indicators, rank of the district and category of the performance of the district. In the middle portion, there will be overall performance of the Rajasthan with respect to all the version.

Top Section of Rajasthan SDG-2 Index

Middle Section of Rajasthan SDG-2 Index

Bottom Section of Rajasthan SDG-2 Index

A passage to clean air

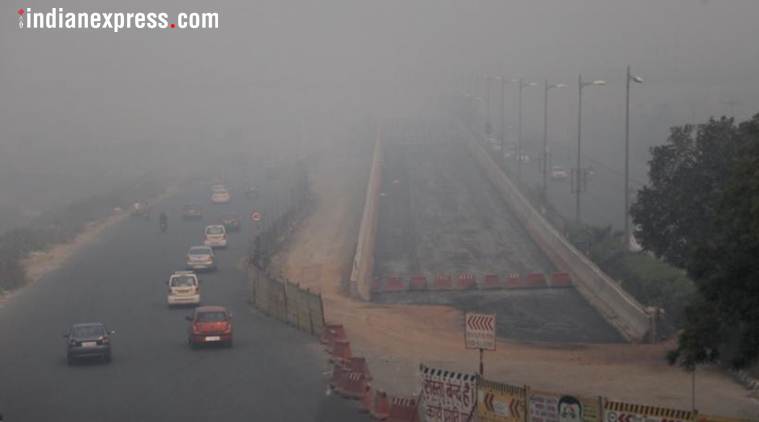
Air pollution kills 7 million people every year. India has 14 out of 20 most polluted cities in the world. Urgent need of comprehensive action plan throughout the year. Provide solutions for clean air in Delhi for better health and quality of life.

Double Stack Loading Planner

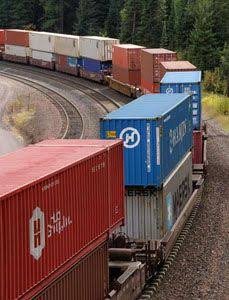
Novel and pioneering customized product with application of optimization tools. Provides an optimal loading plan for Container Corporation of India (CONCOR) based on inventory data and provides millions of annual savings when used consistently.

Development of SDG-2 Dashboard for Rajasthan, India

The objective is “To visualize the state, district and sub-district indicators and data for SDG 2 monitoring to enable evidence-based policymaking to support the efforts of Government of Rajasthan in achieving food and nutrition security in the state. “This includes embed tables, maps and other visualisation tools (Bar charts, Pie charts, Radar charts, etc.) in dynamic form, for SDG-2 vulnerability assessment at the state, district and sub-district level, in the dashboard developed on a user-friendly platform (Power BI/ Tableau).The main expected outcome of this is to have robust SDG-2 dashboard that enables evidence-based monitoring and identification of vulnerable hot-spots for strategic planning and targeted action for achieving ‘Zero Hunger’ in the state of Rajasthan.