

Home Page
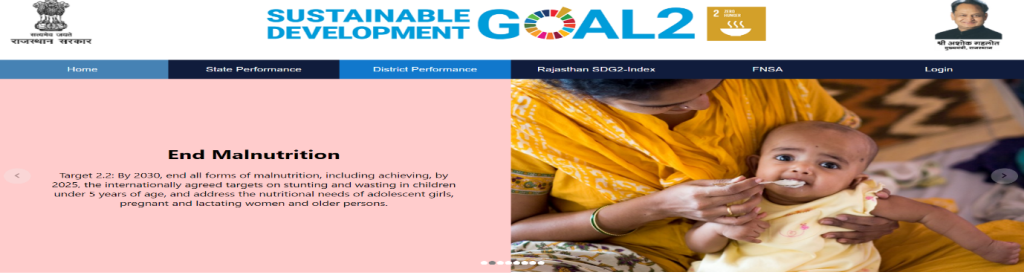
The home page is divided into 2 section. In the top section we have name of all the targets associated with SDG-2 along with the picture that depicts the goal and motive of the target. In the bottom section, we have cards depicting all the targets. User can click on the target and will be re-directed to the state performance which will show the performance of first indicator associated with the clicked target.
Top Section of Home Page
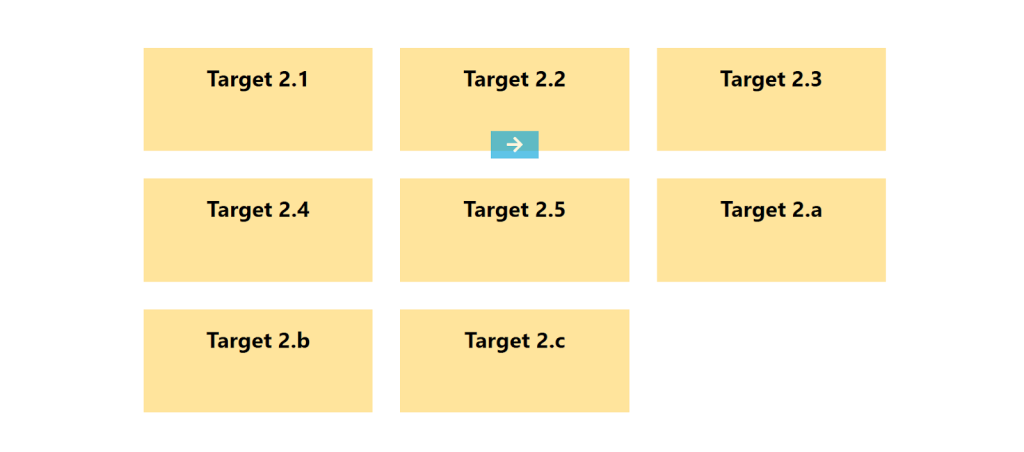
Bottom Section of Home Page
State Performance
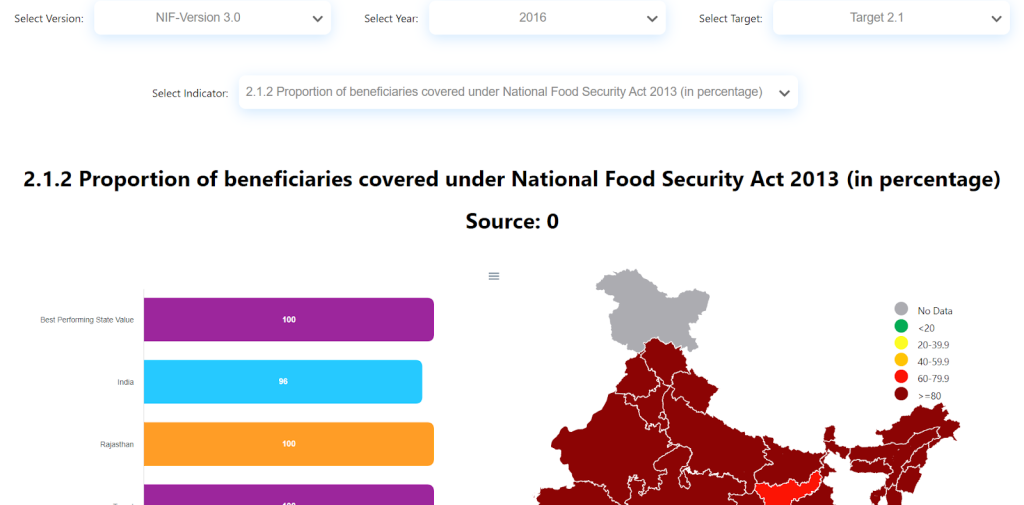
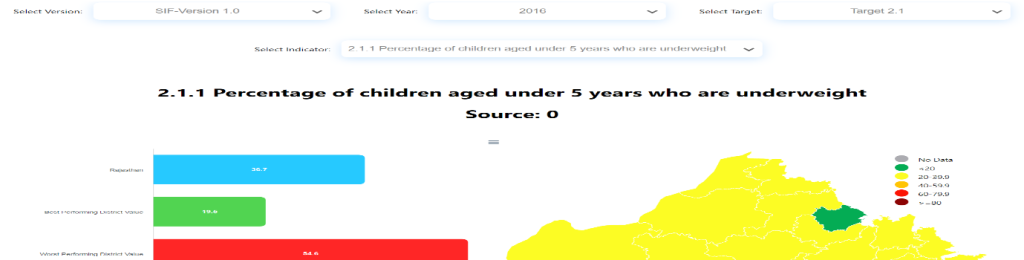
The state performance is divided into 3 section. Here user first need to select the version of the data ,then select the year in which the version is used, then select the target whose performance need to be monitor and then select the respective indicator with respect to the chosen target. In the first session user will see two info graphics. On left side, there is horizontal bar graph will depicts the best performing state, worst performing state, Rajasthan value and standard value of the indicator. On the right side, there is map of India which depicts the performance of all the states with respect to the indicator chosen by hovering on the states. In the middle portion, user can find the performance of all the years with respect to the chosen version. In the bottom portion, user can compare the performance of the 2 selected years with respect to chosen indicator.
Top Section of State Performance Page
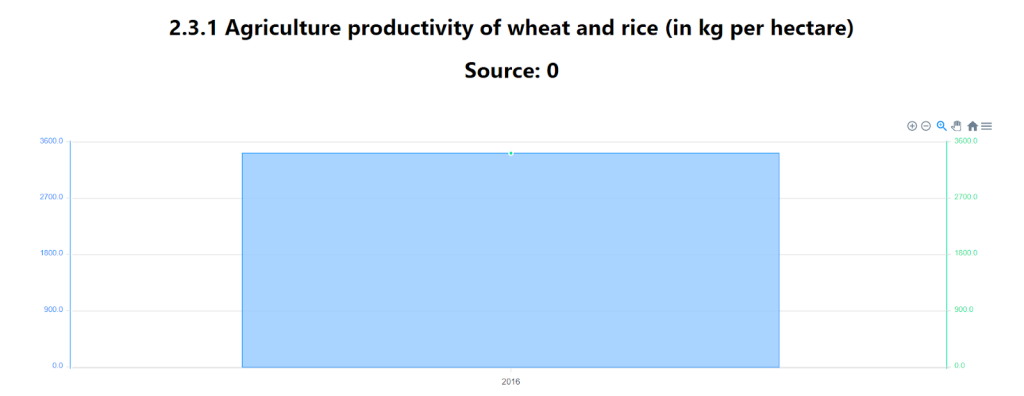
Middle Section of State Performance Page
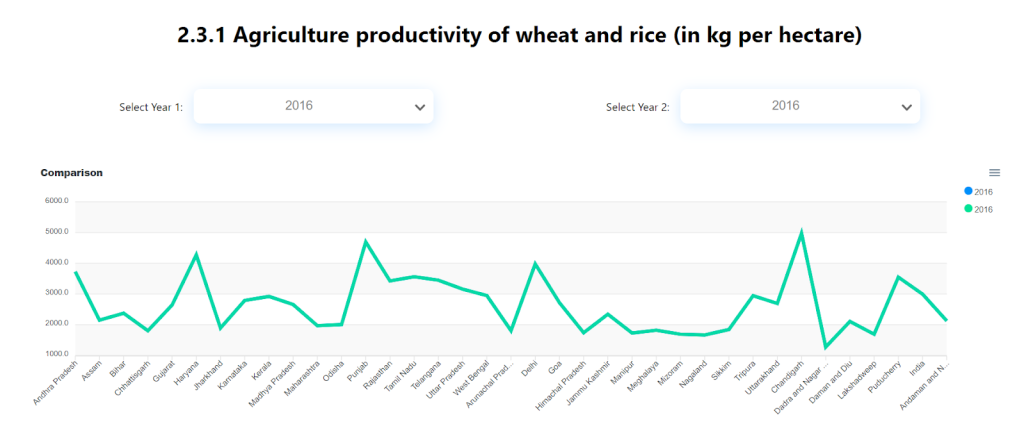
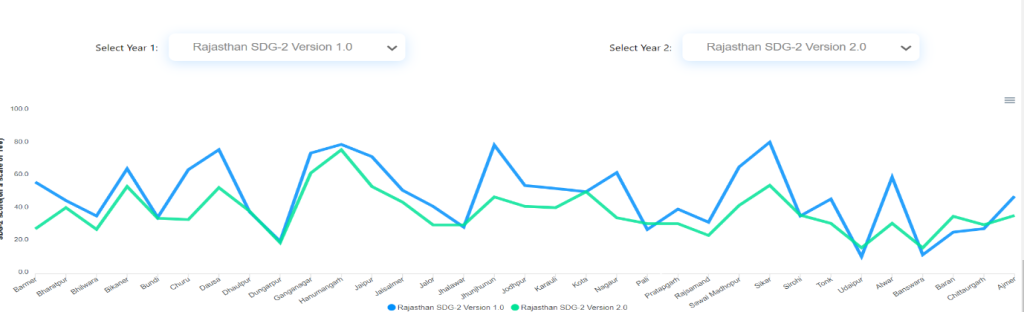
Bottom Section of State Performance Page
District Performance Page
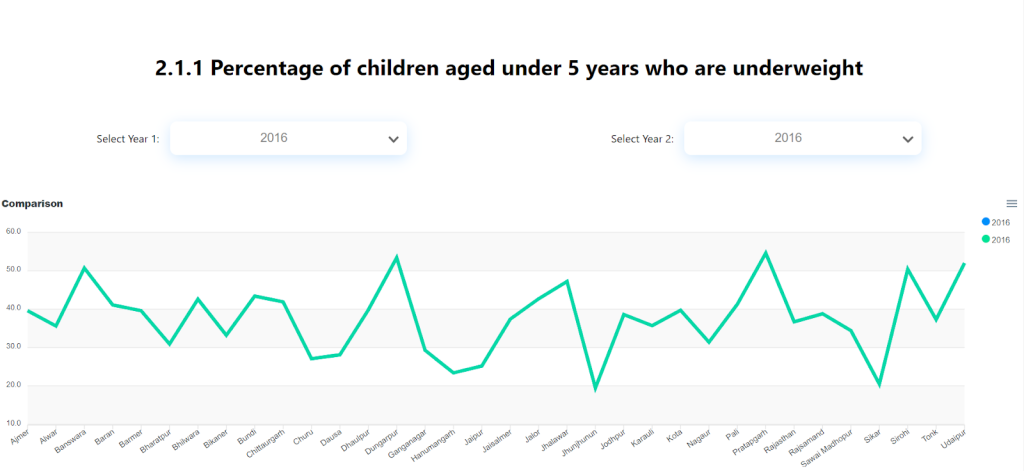
The district performance is divided into 3 section. Here user first need to select the version, then select the year in which the version is used, then select the target whose performance need to be monitor and then select the respective indicator with respect to the chosen target. In the first session user will see two info graphics. On left side, there is horizontal bar graph will depicts the best performing district, worst performing state, and Rajasthan value of the indicator. On the right side, there is map of Rajasthan which depicts the performance of all the districts with respect to the indicator chosen by hovering on the districts. In the middle portion, user can find the performance of all the district with respect to the chosen indicator and compare it with Rajasthan performance. In the bottom portion, user can compare the performance of the 2 selected years with respect to chosen indicator.
Top Section of District Home Page
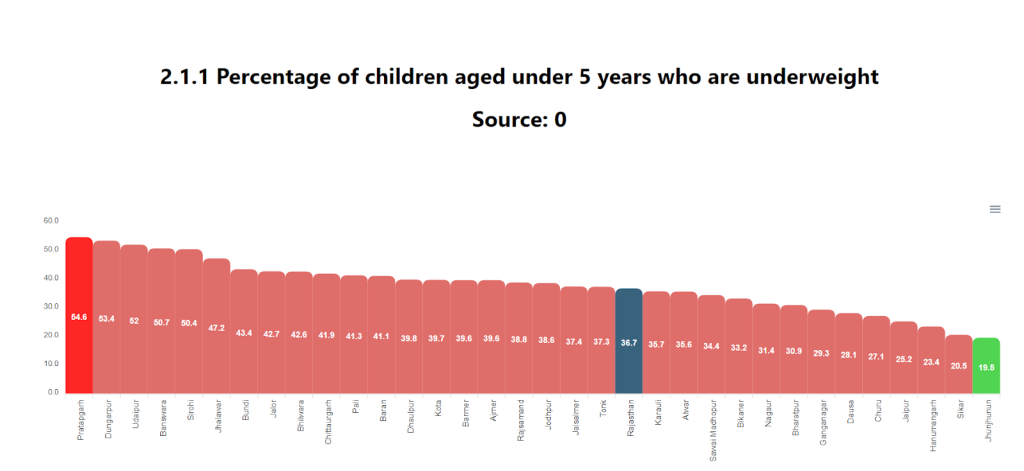
Middle Section of District Performance Page
Middle Section of District Performance Page
Bottom Section of District Performance Page
Rajasthan SDG2-Index
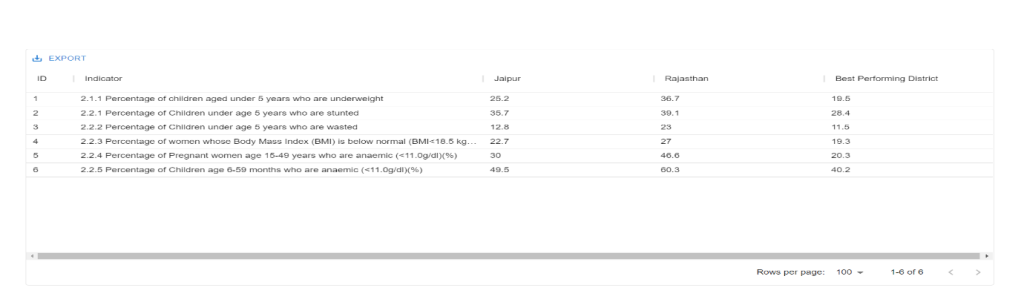
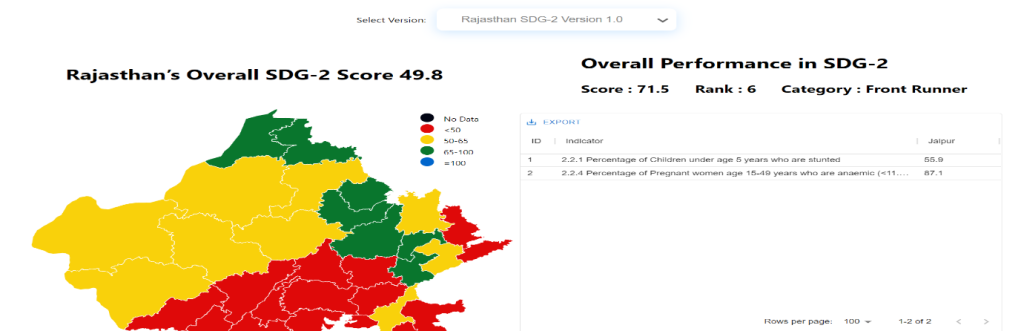
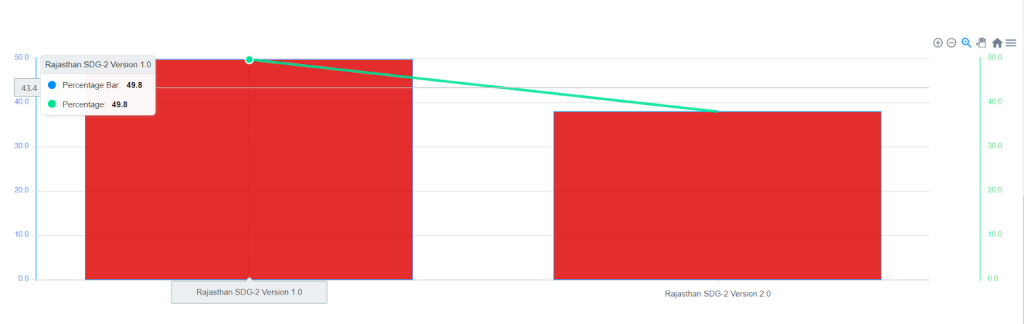
The SDG-2 Rajasthan Index page is divided into 3 section. Here user need to select the version. Once the version is selected the info graphics are represented. The first session there will be map of Rajasthan district on the left side which depicts the overall performance of the district. On the right side, there will be table with represent the indicative value of the indicators, rank of the district and category of the performance of the district. In the middle portion, there will be overall performance of the Rajasthan with respect to all the version.
Top Section of Rajasthan SDG-2 Index
Middle Section of Rajasthan SDG-2 Index
Bottom Section of Rajasthan SDG-2 Index