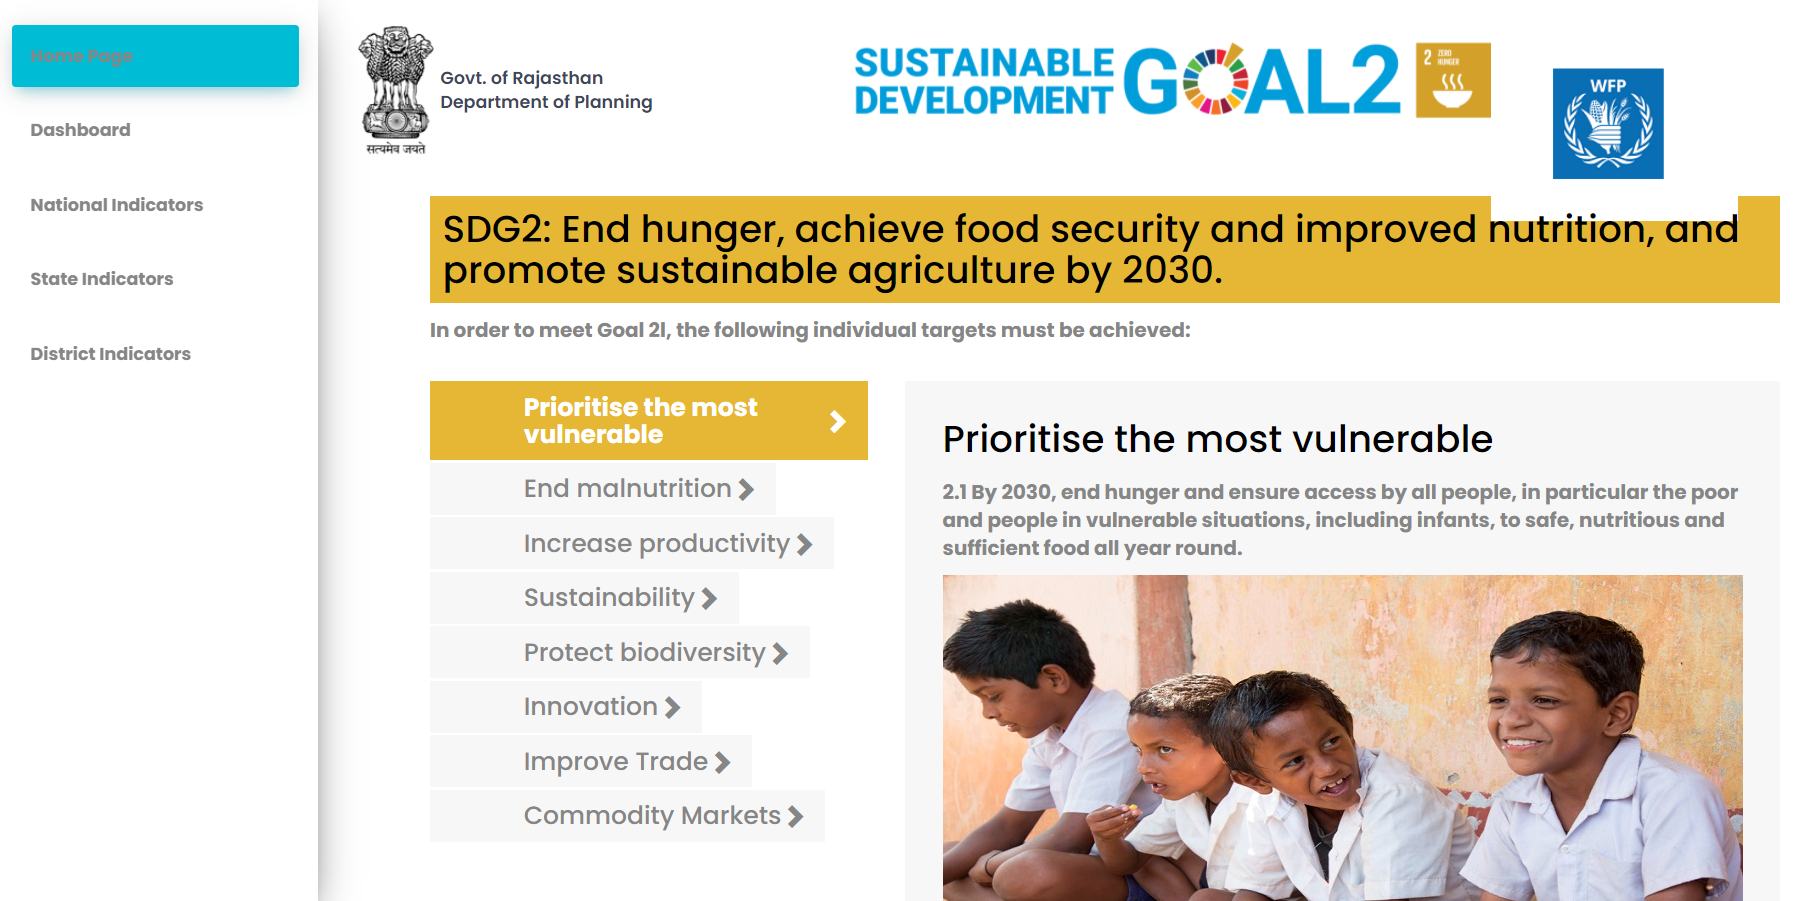
The objective is “To visualize the state, district and sub-district indicators and data for SDG 2 monitoring to enable evidence-based policymaking to support the efforts of Government of Rajasthan in achieving food and nutrition security in the state. “This includes embed tables, maps and other visualisation tools (Bar charts, Pie charts, Radar charts, etc.) in dynamic form, for SDG-2 vulnerability assessment at the state, district and sub-district level, in the dashboard developed on a user-friendly platform (Power BI/ Tableau).The main expected outcome of this is to have robust SDG-2 dashboard that enables evidence-based monitoring and identification of vulnerable hot-spots for strategic planning and targeted action for achieving ‘Zero Hunger’ in the state of Rajasthan.


