
Food Grain Supply Chain Optimization across Indian states
PURPOSE
Foodgrain supply chains are one of the few determinants of food security of India’s poor and vulnerable sections Lapses in these supply chains, as the entire world is realizing due to current Geopolitical circumstances:
- potentially undermines the national food security scenario
- causes wastage due to storage and transit deficiencies
The central government has adopted several plans and schemes such as ‘end to end computerisation of TPDS operations’ to upgrade monitoring and avoid fraudulent beneficiaries. However, none of this directly address supply chain efficiencies. Accordingly, our project addresses the following challenges:
- grain overflow issues arising due to greater procurement for lower storage capacity
- regular transportation in hilly terrains affected by climatic conditions
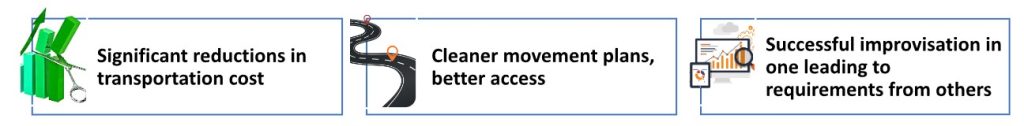
Overall, making the supply chain logistics more efficient & effective by reducing cost and enhancing access.
PROJECT
States incur high transportation costs for TPDS due to difficult terrain, limited resources, restricted windows for transportation and disintegrated storage spaces. To address this and ensure pre-prepositioning of adequate safety stocks in the areas where access is affected by seasonal and predictable hazards, the Public Systems Lab supports the states through supply chain optimization. An Operations Research (OR) based mathematical programming model helps minimize the total transportation cost while incorporating all practical conditions to make it implementable.
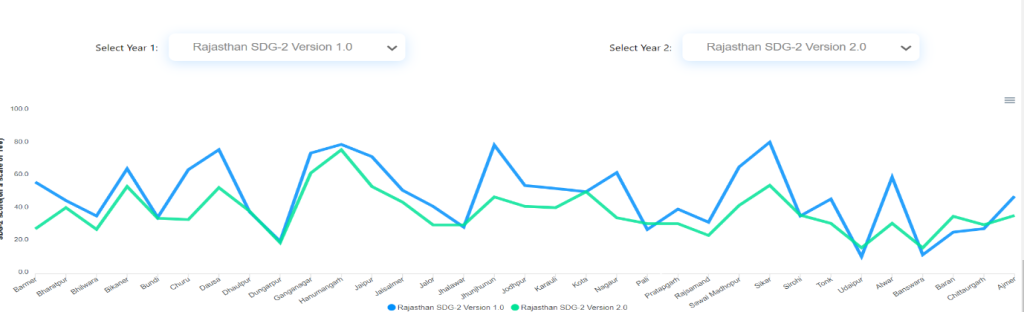
Outcome:
WAY AHEAD
The PSL currently is building supply chain optimization models in all states across the country based on their specific requirements. As already demonstrated, our strategically planned modeling interventions will:
- respond to the challenges and contingencies of different states
- drastically reduce the levels of food wastage, while effectively meeting the needs of all targeted beneficiaries
- reduce the cost of transportation for the government, and
- expand to include allied logistical challenges as required by the states
Our team will have experts from academia (IITs) and a strong partnership with the leading multilateral organization in this area, the United Nations (UN) World Food Programme (WFP). Leveraging expertise from various stakeholders, as required, the project team will increase efficiency and effectiveness in PDS.
.
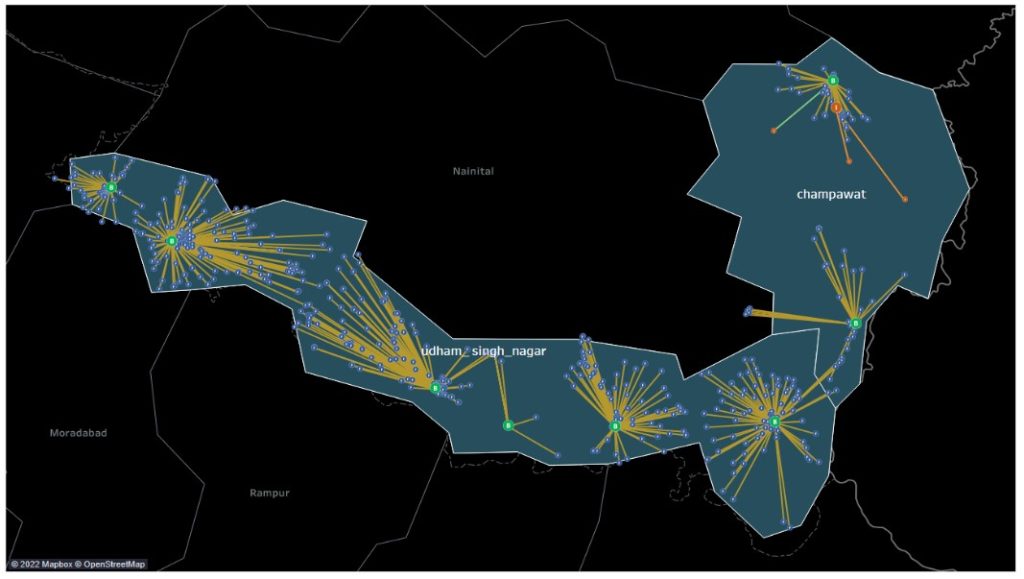
Fig: Optimal plots shown for the districts of Udham Singh Nagar and Champawat. Uttarakhand


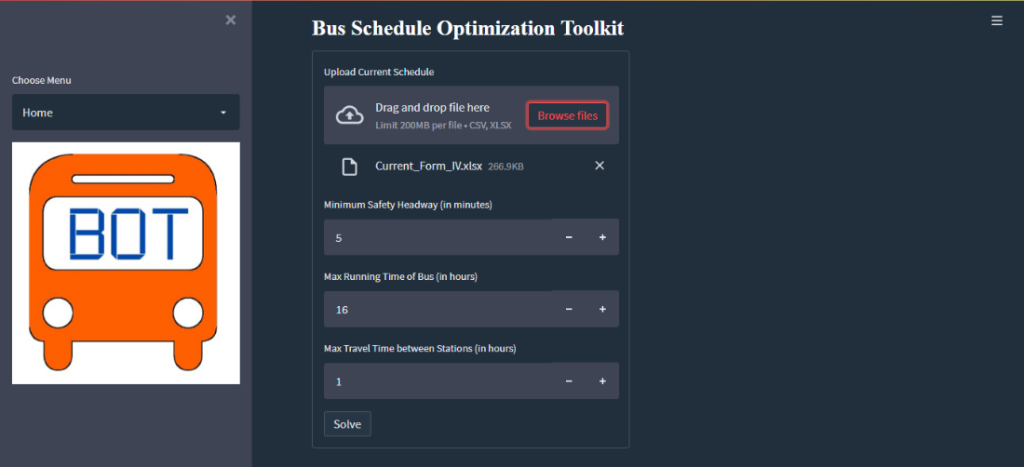

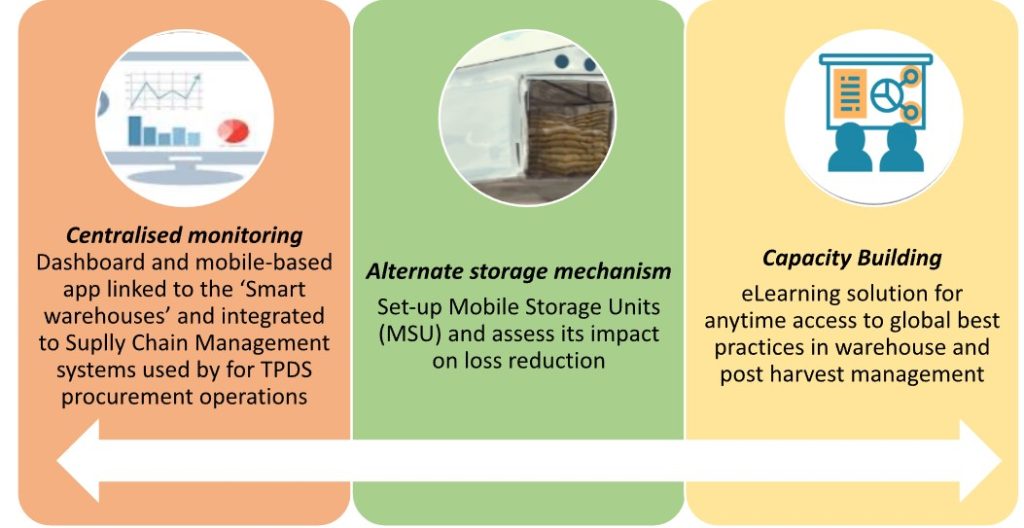
 GUI- Monitoring